Verizon launched 69 of its 80 active Meta ads in the last 14 days. The median flight time is 5 days. They're burning through creative faster than most ecommerce brands test a single ad set.
AT&T is running the opposite playbook. Their median flight is 65 days, with 9 ads past the 90-day mark and zero ads less than a week old. T-Mobile sits in between, with 90% headline diversity and the only identifiable influencer creative in the set.
I pulled all three accounts from the Meta Ad Library on May 16, 2026: 80 Verizon ads, 30 from AT&T, and 30 from T-Mobile, sorted by total impressions. If you've ever searched "verizon facebook ads" trying to figure out their ad strategy, this is the full picture. Every example below is verbatim copy from the actual ad, with a Library ID link so you can verify it yourself. This is a creative read, not a performance read. We can't see CPA or ROAS from public data. But we can see which bets each carrier is willing to defend with sustained spend, and that's usually a more honest signal than a conference panel.
What you need to know
- Verizon: 80 ads, 71% video, 95% "Shop Now" CTA, median 5-day flights. Device offers dominate. Headline diversity is just 39%, the lowest of the three.
- AT&T: 30 ads, 63% video, 97% "Learn More" CTA, median 65-day flights. Slow rotation, battle-tested creative. Spanish-language ads are their top performers.
- T-Mobile: 30 ads, 60% video, 73% "Learn More" CTA, 90% headline diversity. Only carrier running influencer/UGC creative. "Try our network free" is a risk-reversal angle neither competitor uses.
- The shared blind spot: All three default to a single CTA type. None are testing funnel-stage CTA diversity. If you run consideration and purchase CTAs in the same ad set, you're already more sophisticated than these billion-dollar media teams.
The footprint: Verizon by the numbers
Pull Verizon's page in the Meta Ad Library and the first thing you notice is volume. 80 active creatives in the scrape window, with 57 videos and 23 static images. That's a 71% video mix, the highest of the three carriers in this analysis.
The average flight time is 8.2 days. The median is 5 days. To put that in context: 53 of Verizon's 80 ads have been running for less than a week. Another 16 launched in the 8-to-14-day window. Only 4 ads in the entire set have survived past 30 days, and none have crossed 90.
Compare that to a typical ecommerce account, where a winning ad might run 15 to 30 days before fatigue sets in. Verizon isn't waiting for fatigue. They're cycling creative before it has a chance to tire out, which means either their testing velocity is very high or their creative burns out fast. Probably both.
The 4 longest-running ads are all static images: product shots of the iPhone Air 256GB (46 days), iPhone Air 1TB (40 days), and Google Pixel 9 Pro XL 256GB (40 days). The videos churn. The product catalog shots persist. That's a pattern worth noting if you manage both format types in your own account.

Verizon's copy playbook: three bets
Across 80 ads, Verizon's creative strategy breaks into three clusters. Each one has its own copy pattern, product focus, and job in the funnel.
Bet 1: Device offers
This is the dominant theme. 27 of 80 ads fall into the "Offer / promotion" cluster, and the pattern is consistent: device name as headline, a switch incentive in the body, "Shop Now" as the CTA.
The three longest-running ads in the entire set are all device offers:
-
"Choose the iPhone that's right for you and save with Verizon's best deals." Headline: iPhone Air 256GB. Running 46 days. (Library ID 1736555093977807)
-
"Get a $100 Verizon e-Gift Card when you switch and purchase a new smartphone with a new line on myPlan. Applied at checkout. Online only." Headline: iPhone Air 1TB. Running 40 days. (Library ID 936084279126502)
-
"Get a $100 Verizon e-Gift Card when you switch and purchase a new smartphone with a new line on myPlan. Applied at checkout. Online only." Headline: Google Pixel 9 Pro XL 256GB. Running 40 days. (Library ID 2354400185066574)
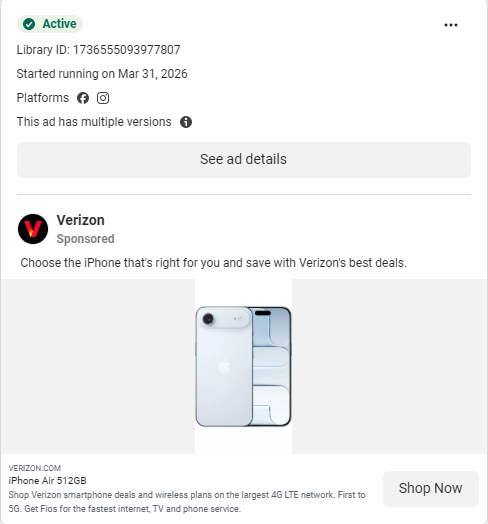
Notice the copy reuse. Two of the three top performers run identical body text, just swapped to a different device headline. That's a template, not a one-off. The "$100 e-Gift Card when you switch" offer is doing the heavy lifting; the device name is the variable.
If you're running product-catalog ads in ecommerce, this is the same pattern: one proven offer structure, rotated across your top SKUs. Verizon just does it at carrier scale.
Bet 2: Switch incentives and the "no trade-in" hook
The second cluster focuses on removing the switching objection. "No trade-in needed" appears across at least 22 ads in the set, and the copy pattern is tight and direct:
-
"Big savings on iPhone 15. No trade-in needed. With new line on myPlan." (Library ID 1321550389952108)
-
"Big savings on iPhone 16 with new line on myPlan. No trade-in needed." (Library ID 26929936729977761)
-
"Get ready to save big on the new Galaxy S26+. No trade-in needed." (Library ID 1476464180876224)
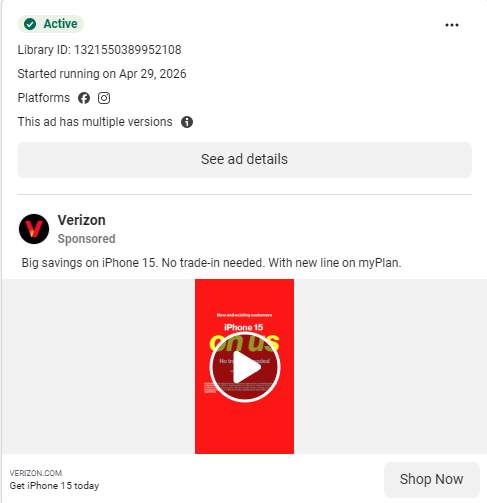
The "no trade-in" language is an objection-removal play. It's the clearest signal of Verizon's ad strategy on Meta right now: they've decided that the friction of trading in an old device is a bigger barrier than price. The fact that they're defending it across 22+ creatives suggests it's working.
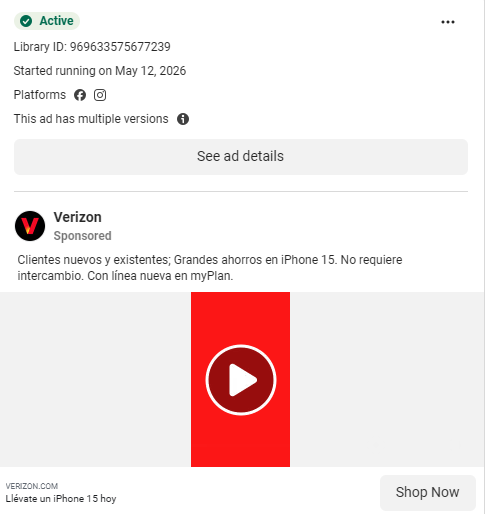
Verizon is also running Spanish-language variants of this same cluster: "Clientes nuevos y existentes; Grandes ahorros en iPhone 15. No requiere intercambio." (Library ID 969633575677239) and "Llevate el nuevo Galaxy S26+ con linea nueva en Unlimited Unlimited. No necesita intercambio." (Library ID 1508752930844226). Same offer structure, translated. Not a separate campaign with a different angle.
If your product has a switching cost (migration fees, setup time, contract terms), this pattern translates directly. Name the friction. Remove it in the headline. Repeat it until the data says otherwise.
Bet 3: Fios home internet
The third cluster is the sleeper. "Fios" appears in the copy of 70 out of 80 ads (87.5%), even when the ad is primarily about wireless. Verizon is cross-selling home internet in nearly every ad they run.
The dedicated Fios ads are straightforward:
-
"Switch to Fios 2 Gig and experience our fastest internet ever." Headline: Fios Home Internet. (Library ID 950717887932850)
-
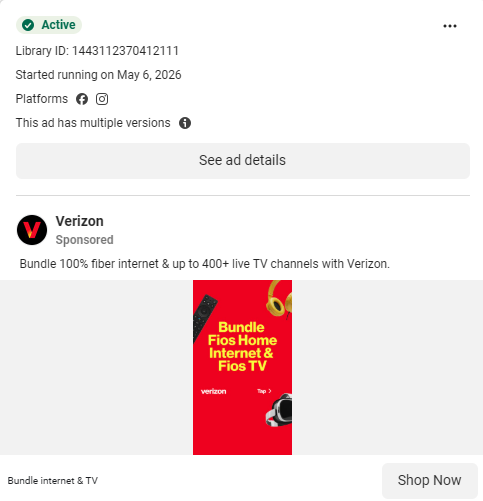
"Bundle 100% fiber internet & up to 400+ live TV channels with Verizon." Headline: Bundle internet & TV. (Library ID 1443112370412111)
-
"Bundle 100% fiber internet & up to 400+ live TV channels with Verizon." Headline: Switch to Verizon. (Library ID 1002899245752478)
The takeaway for your account: Verizon treats every ad as a cross-sell opportunity. Even the wireless device ads mention Fios in the link description. If you sell multiple products or tiers, embedding your secondary offer in every ad's body copy (not just in dedicated campaigns) is a low-effort way to increase consideration across your catalog.
What Verizon is getting wrong
Volume masks problems. Here are three structural weaknesses any competitor can target.
39% headline diversity
Verizon's headline diversity ratio is 39%. That means only about 3 in 10 ads have a unique headline. The top headline is repeated 56 times across the set. Three headlines appear 3 or more times each.
For comparison, T-Mobile's headline diversity is 90%. AT&T sits at 67%. Verizon is the least creative of the three by this metric, and the gap is not small.
Low headline diversity creates two risks. First, creative fatigue hits faster when users see the same headline repeated in different placements. Second, it means Verizon is testing fewer angles than its competitors. If you're competing for the same audience, you have more room to find messaging they haven't tried.
CTA monotony
76 of 80 Verizon ads use "Shop Now" (95%). Only 4 use "Learn More." No "Sign Up," no "Get Quote," no "Compare Plans," no consideration-stage CTA at all.
The entire funnel is bottom-of-funnel. That works if every person seeing the ad is already a qualified buyer ready to purchase a phone. It doesn't work for the audience still comparing carriers, researching plans, or just curious about switching. Verizon's CTA strategy leaves those people with nothing to click.
No visible variant testing
Most Verizon ads show a single creative variant. A few show 2. None show 3 or more. For a brand running 80 concurrent ads, the lack of visible A/B testing within ad units is surprising. They're testing breadth (many ads) but not depth (many variants per ad). AT&T and T-Mobile are also weak here, but Verizon's volume makes the gap more visible. If you're pitching a client on structured creative testing, this is your proof point: even billion-dollar ad budgets skip it.
AT&T: the slow-burn operator
AT&T runs the opposite strategy. Where Verizon is fast and disposable, AT&T is slow and persistent.
30 ads in the scrape window. Median flight: 65 days. 9 ads have been running for more than 90 days. Zero ads launched in the last 7 days. AT&T barely refreshes. Their creative either works or it doesn't, and the winners stay live for months.
The top performer is a Spanish-language video that's been running 126 days: "Obten hasta $800/linea por romper tu contrato! Cambiate a cualquier plan, pagamos el saldo de tu telefono, hasta 10 lineas." (Library ID 893442979748235). A contract buyout offer, running since January 10, 2026. That's not a test. That's a proven machine.
AT&T's second-longest-running ad (130 days) is also Spanish-language, promoting the Next Up Anytime upgrade program. (Library ID 4216387301964232). Their most persistent creative assets target the US Hispanic market. If you're researching competitor targeting, this is exactly the kind of signal that reveals audience strategy: the ads they let run longest tell you which segments deliver.
The English-language set runs two consistent angles.
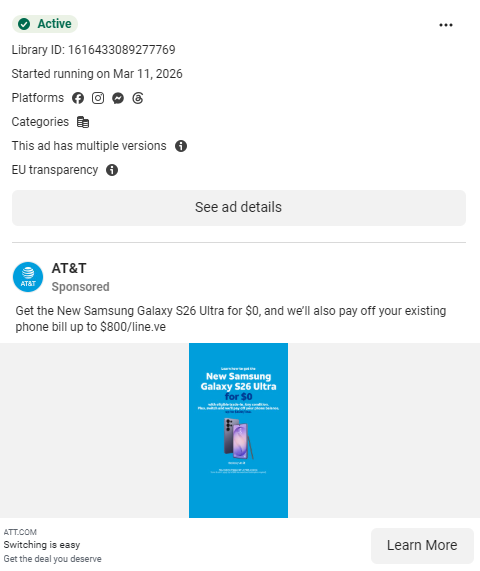
The first is "Switching is easy" as a persistent headline: "Get the New Samsung Galaxy S26 Ultra for $0, and we'll also pay off your existing phone bill up to $800/line." (Library ID 1616433089277769). The $0 device plus $800 bill payoff is AT&T's core offer, repeated across their highest-impression ads.
The second is AT&T Next Up Anytime, a product hook neither competitor can copy: "With AT&T Next Up Anytime, upgrade early without worrying about the remaining balance of your installment plan." (Library ID 1012036514481388). The upgrade program is AT&T-specific, which makes it the only truly differentiated angle in this entire 140-ad set.
The CTA picture is even more extreme than Verizon's, just in the opposite direction. 29 of 30 AT&T ads use "Learn More" (97%). Not a single "Shop Now." AT&T's entire Meta presence is consideration-stage. They're driving traffic to learn, not to buy. Whether that's strategic (longer sales cycle for family plans) or just inertia is something only their performance data could answer.
T-Mobile: the influencer play
T-Mobile is the experimenter. Of the three carriers, they have the highest headline diversity (90%), the most CTA variety (3 types: Learn More, Shop Now, and a direct TMOBILE.COM button), and the only identifiable influencer creative in the set.
Their top-performing ad is a video featuring Dylan Fauver, a creator whose name appears as the headline. "Dylan Fauver with T-Mobile." (Library ID 1832128194120948). Running 38 days. The #4 performer is another influencer video: "Thewilliamsondad with T-Mobile." (Library ID 2104525523736628). Running 38 days.
Neither Verizon nor AT&T runs a single ad with a named creator in the headline. T-Mobile is the only carrier in this set investing in UGC-style influencer creative at the Meta Ad Library level. In a feed full of polished device shots and offer cards, a face stands out.
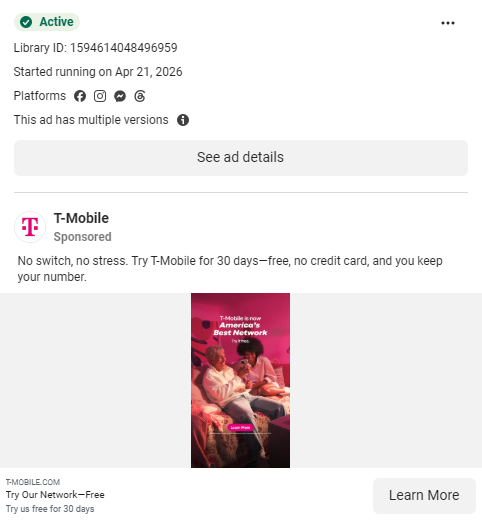
The most interesting ad in the entire T-Mobile set isn't a device push. It's a risk-reversal offer that no other carrier is running: "No switch, no stress. Try T-Mobile for 30 days, free, no credit card, and you keep your number." Headline: Try Our Network, Free. (Library ID 1594614048496959). A 30-day free trial with no credit card and number porting. In a category where switching costs are real (new SIM, potential coverage gaps, contract overlap), T-Mobile is removing every objection in a single ad.
T-Mobile also matches Verizon and AT&T on Spanish-language investment: "Escuchas eso? Tu nuevo iPhone te esta llamando. Cambiate a T-Mobile y llevate hoy un iPhone." (Library ID 967894658970279). And they're pushing home internet alongside wireless, just like Verizon: "Level up your setup with T-Mobile Fiber Home Internet, built for the way you live and play." (Library ID 1278199257779029).
If you're building a competitive audit deliverable for a client in any category, T-Mobile's approach is worth studying. They're testing more angles, using more formats, and running a risk-reversal offer that creates a completely different conversion path than the standard "Shop Now" device push.
Three-way comparison: format, CTA, and velocity
Here's the side-by-side view. Every number traces to the analyst briefs from our May 16, 2026 scrape.
| Metric | Verizon | AT&T | T-Mobile |
|---|---|---|---|
| Ads sampled | 80 | 30 | 30 |
| Video % | 71% (57/80) | 63% (19/30) | 60% (18/30) |
| Image % | 29% (23/80) | 37% (11/30) | 40% (12/30) |
| Median flight (days) | 5 | 65 | 39 |
| Mean flight (days) | 8.2 | 72.5 | 37.2 |
| Headline diversity | 39% | 67% | 90% |
| Dominant CTA | Shop Now (95%) | Learn More (97%) | Learn More (73%) |
| CTA types used | 2 | 1 | 3 |
| Ads < 7 days old | 53 | 0 | 0 |
| Ads 90+ days | 0 | 9 | 0 |
| Top theme | Offer/promotion (27) | Offer/promotion (13) | Offer/promotion (14) |
| Spanish-language ads | Yes | Yes (top performers) | Yes |
| Influencer/UGC | No | No | Yes |

Three things stand out from this telecom meta ads strategy comparison.
Verizon is a volume-and-velocity machine. They test more creative than either competitor and discard it faster. Their weakness is depth: low headline diversity, one CTA, minimal variant testing within ad units.
AT&T is a set-it-and-forget-it operator. They find what works and let it ride. Their 126-day top performer would be considered ancient in most ecommerce accounts. Their weakness is freshness: zero new ads in the last 7 days suggests either a pause in creative production or a very deliberate slow-rotation strategy.
T-Mobile experiments the most. They're the only carrier running influencer creative, the only one with a true risk-reversal offer, and they have the highest headline diversity at 90%. Their weakness is that nothing has broken through to the 90-day sustained performance tier. They cast a wide net but may not be consolidating winners as aggressively as AT&T.
We ran a similar methodology on Gusto vs. Rippling vs. Paylocity in the SaaS payroll space. The pattern holds across verticals: the brand with the longest-running ads isn't always the best creative team, but they're the one with the most confidence in what's already working.
Five patterns you can steal this week
You don't need a telecom budget to use these patterns. Each one maps to a specific finding from the data above.
1. Run a CTA diversity test. All three carriers default to one CTA type. Verizon is 95% "Shop Now." AT&T is 97% "Learn More." T-Mobile is 73% "Learn More." Test funnel-specific CTAs in your own account: "Learn More" for cold audiences, "Compare Plans" (or your equivalent) for consideration, "Shop Now" for purchase-ready. You'll be running a more diversified funnel than any of these carriers.
2. Steal the "no trade-in" objection-removal pattern. Verizon repeats "no trade-in needed" across 22+ ads because it removes the biggest switching friction. Rewrite it for your category: "No long-term contract needed." "No migration fee." "No credit card required." T-Mobile already does this with their 30-day free trial. Find the friction your buyer fears most and kill it in the headline.
3. Embed your secondary product in every ad. Verizon mentions Fios in 87.5% of their ads, even when the primary offer is a wireless device. Your secondary product (or upsell tier, or add-on service) should appear in the body copy of every ad, not just in dedicated campaigns. It's a low-cost way to increase consideration.
4. Test influencer or UGC creative if your competitors aren't. T-Mobile's top performer is a creator video. Verizon and AT&T run zero identifiable UGC. When the incumbent creative in a category is all polished product shots and offer cards, a face in the feed is a format differentiator. If your competitors aren't using it, the format itself creates contrast.
5. Audit your headline diversity ratio. Pull your active ads and count unique headlines divided by total ads. (If you need a framework for this, see our guide to reverse-engineering competitor targeting.) If you're below 50%, you're closer to Verizon's repetition problem (39%) than T-Mobile's breadth advantage (90%). Low diversity means you're testing fewer angles and creating more fatigue risk. Push for at least 5 distinct headline hooks per ad set.
Want this kind of teardown on your own competitors? Our sample competitor reports show a brand's active Meta ads, format mix, and CTA distribution. For the full breakdown with every ad, flight duration, copy theme, and exportable data, the Competitor Snapshot report is $24.99 and covers exactly the kind of analysis you just read.